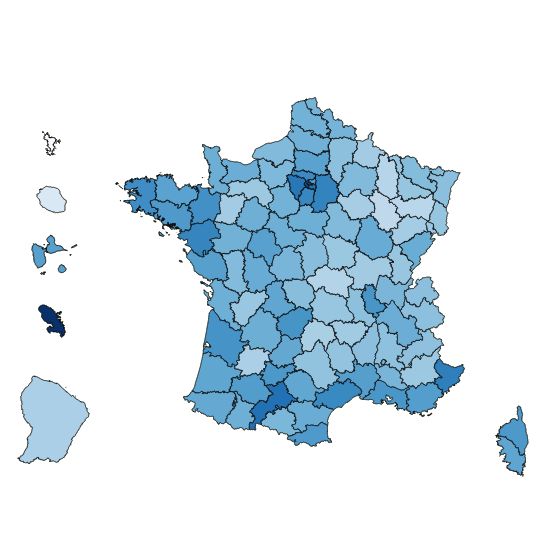
COVID-19 epidemic indicators
A classic table vs an interactive map and charts: what dataviz reveals that a table leaves out. Data from Santé publique France.
Hello! My name is Benjamin  .
.
I work with data end-to-end — from collection to decision — with a real flair for dataviz. Based in Metz, France.
Governance, architecture, BI, visualization: I build clear, accessible tools that teams actually adopt to steer their activity.
I work across the whole data chain — from collection to decision — with a dataviz signature. 15 years of experience, on a wide range of projects.
Data mapping, master data strategy (MDM), indicator catalogue & dictionary (DataGalaxy), KPI definition.
Data warehouses, pipelines & ETL, cloud platforms (Microsoft Fabric, Snowflake, Talend), application interfacing.
Decision-making dashboards (Power BI), dimensional modelling, DAX, reporting industrialisation.
Interactive visualisations & data storytelling (Tableau, D3.js, 3D web) to make information accessible to everyone.


What are your objectives and what information is needed to achieve them?
What data do your information systems contain to address these questions?
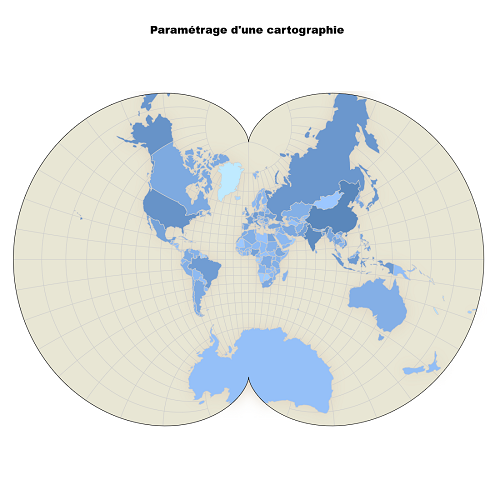
Visual language is intuitive and effective: it simplifies complex problems and reaches a broad audience. Visualization tools are essential to analyze large volumes of information and make data-driven decisions. Their benefits are many: a synthetic view of complex information, intuitive reading and quick understanding. Visualization resonates with your audience and sparks engagement.